This is part 3 of this topic about geodatabases. Why did I choose this picture??? Good question. A review of the plan is below:
The plan:
Part 1 -- introduce the feature dataset and how to add your shapefiles
Part 2 -- introduce topology and two very useful rules: Must Not Overlap and Must Not Have Gaps
Part 3 -- introduce working with coincidence and Area Boundary Must Be Covered By Boundary Of
Part 4 -- editing Area Boundary Must Be Covered By Boundary Of errors
This information is taken in part from my ArcGIS Desktop: Geodatabase Power User class. For more in-depth detail, you can sign up for my class. More information at Web Classes.
Please note that I just don't have the time to go into the detail of this topic that you receive in my classes. There are many tweaks and issues to look at. We discuss many of them in the regular class.
The status:
Okay, so last time I covered building topology and using the Must Not Have Gaps and Must Not Have Overlaps rules for a single feature class. These two rules, I feel, are the basis for all polygon feature classes.
Do all rules have to be implemented at once? No. To ease your error management issues, you can implement rules in stages from simple to complex. So I recommend running the Gaps and Overlaps rules on most polygon feature classes before doing anything else. Additionally, if you fix the simple errors first, then add more complex rules, the validation process will take less time to run. I believe in Part 2 I talked about how much time a validation could take. KISS rules here! (Keep It Simple, Stupid!)
New rule -- Area Boundary Must Be Covered By Boundary Of:
This rule is simply outstanding and I love it! It allows for all sorts of coincidence checking and I'm surprised at how few people use this rule.
In the example below, I've created a topology between two simple feature classes: zoning and parcels from city data I have. For the most part, zoning should run along parcel lines in this city. Like many cities, they've maintained zoning and parcels separately and realize that they are not coincident where they should be. Now they want to capitalize on topology and set some rules to control coincidence.
I created a FDS, then a topology named Aggregate. Following are images of the properties for the topology.
Note the cluster tolerance happens to be very small. This is the minimum distance that can be used and it's automatically calculated by the software.
Note that I assume here that the parcels are "better" than the zones and I want the zones to "snap" to the parcels... at least moving 0.00328 ft. I do this by ranking parcels 'higher' than zoning. There may be issues with increasing your cluster tolerance and you should test your amounts. For instance, you may want to move your zones up to 10 feet so they would basically "snap" to the parcels. Remember, tough, this cluster distance is also applied to your parcels perhaps making other problems you hadn't planned on. We do this comparison in the class and it's quite fun and informative to see the results.
I only added one rule in this example -- "Are Boundary Must Be Covered By Boundary Of". I may also be interested in "Must Not Overlap" and "Must Not Have Gaps", but with these feature classes I had already run those two rules and now don't need them at the moment. Yes, you can remove rules once you've cleaned up your errors.
Let's now look at some results.
I would call this some 'dirty' data. There are many coincident errors. But, this provides lots of learning! Let's zoom into an area towards the upper right. I'll also change some of the symbology to help in deciphering the issues. Also, the image will be large to help see the full resolution of the problem. So if this blows the page size, I'm sorry.
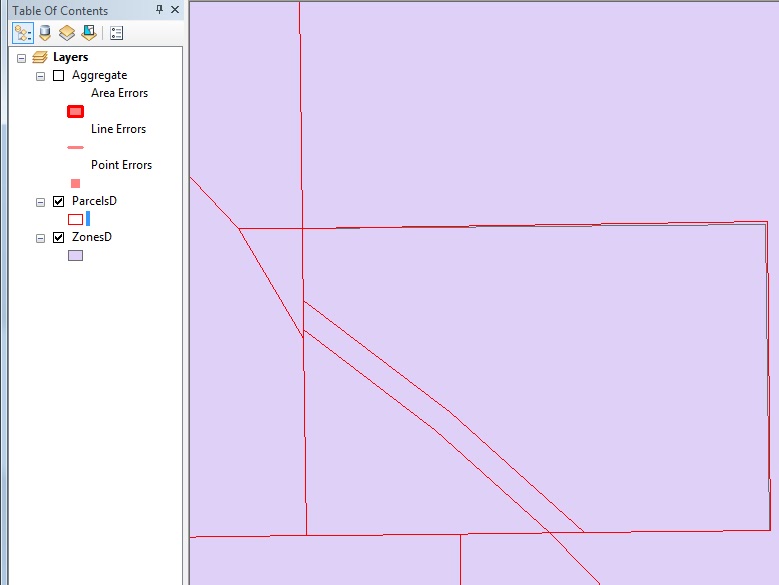
Looking at the legend in the Table of Contents, you see that errors are pink. Parcels are outlined in red (and no fill color). Zones are outlined in black and filled with purple. You can observe there are two edges of this parcel that are not coincident.
By turning of the visibility for the errors, you can see the black and red lines pulling apart from each other at the top and right sides.
Let's look at one more location where it's obvious that the zoning line was developed as an average of the parcels. Do you want that? It's up to you. But at least you can see the errors and fix them if you wish.
This image shows the pink errors displayed.
Turning the errors off, you can see the zoning lines that are very different from the parcel lines.
Summary
Well, now you've seen some errors that are highlighted by building topology. In the last part of this series, we'll look at some tools to edit and repair errors.
Upcoming classes
If you really want to get a lot deeper into geodatabases and topology, sign up for ArcGIS Desktop: Managing Data and ArcGIS Desktop: Geodatabase Power User. If you've read this far and enroll in either of these two classes that are scheduled below email me and I will refund 5% to your credit card!
Click the image to follow the link to the web pages.
Click the image to follow the link to the web pages.
Thank you.
As always, I appreciate your comments, suggestions, and even spelling correcetions!
Happy Geodatabasing!
Happy Geodatabasing!


No comments:
Post a Comment